Manuscripts, figures and grant proposals, made ready for review

I edit your manuscript, act as reviewer #2 and give you robust feedback, and rebuild your figures with reproducible code you can rerun. You find out what is wrong with the paper while there is still time to fix it.

For early-career biomedical researchers in the UK, Hong Kong and elsewhere with a paper or grant proposal close to submission.

Provide your abstract for a quote See the rebuilt figures

After: every sample plotted as a point for four groups, with the mean and 95% confidence interval beside each group. Before: a bar chart of four group means with SEM whiskers and asterisks. Before After
Drag across the figure. The original is left of the line and the rebuild is right of it. Simulated data.
  • PhD (Genetics) from the University of Manchester
  • First-author papers in Nature Communications and IOVS
  • Editing scientific and medical manuscripts since 2013

Three figures, before and after

Each example shows a figure as it might arrive, what is wrong with it, what I changed and a few lines of the script behind the new version. All three examples use synthetic data.

Case 1: a bar chart that hides the data
Before
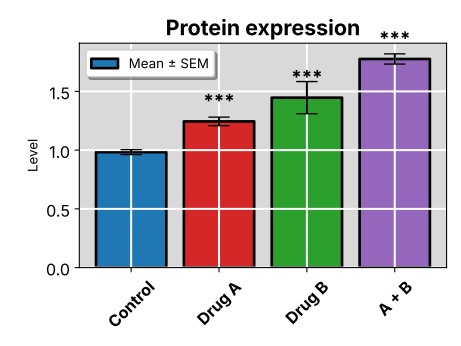
Bar chart of mean protein level in four groups, with SEM whiskers, asterisks, thick outlines and a grey background.
After
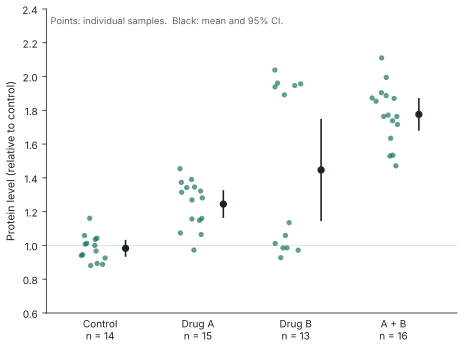
The same four groups with every sample shown as a point. Drug B splits into two clusters. The mean and 95% confidence interval sit beside each group and group sizes are printed under the axis.

Diagnosis

Four bars with SEM whiskers and a row of asterisks. You can't tell how many samples sit behind each bar, and the two clusters in the Drug B group have been averaged into one mean that describes neither of them.

Treatment

Every sample is plotted, with the mean and 95% confidence interval beside it and the group size on the axis. The points share one colour because the axis already names the groups.

From the script

for i, (name, values) in enumerate(groups.items()):
    # every sample, nudged sideways so the points do not overlap
    x = i - 0.08 + rng.uniform(-0.14, 0.14, len(values))
    ax.scatter(x, values, s=16, color=ACCENT, alpha=0.65, lw=0)

    # mean and 95% confidence interval, drawn beside the points
    low, high = ci95(values)
    ax.plot([i + 0.26] * 2, [low, high], color=INK, lw=1.2)
    ax.plot(i + 0.26, values.mean(), "o", color=INK, ms=4.5)
Case 2: a heatmap nobody can read

Before
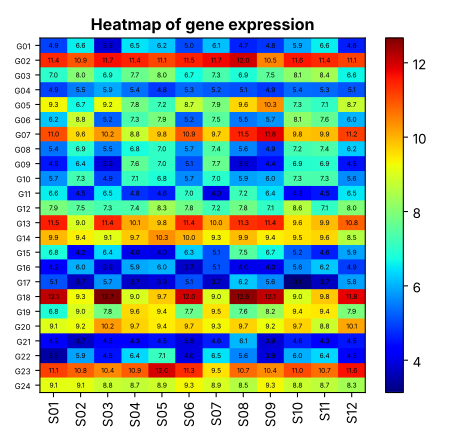
Heatmap of 24 genes by 12 samples on a rainbow colour scale, with a number printed in every cell and genes in alphabetical order.
After
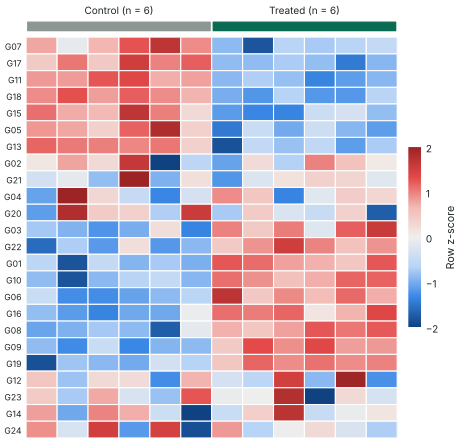
The same data as row z-scores on a blue to red scale. Genes are clustered into a block that falls with treatment, a block that rises and a block that does not change. Control and treated samples are marked along the top.

Diagnosis

Raw values on a rainbow scale, a number printed in every cell and genes listed in alphabetical order. The colours mostly show which genes are abundant, and the treatment effect is in there somewhere.

Treatment

Each gene is scaled to a z-score and the rows are clustered, so genes that move together sit together. The scale runs from blue to red through a neutral midpoint at zero, and the two sample groups are marked along the top.

From the script

# z-score each gene, so colour shows change and not abundance
z = stats.zscore(expr, axis=1)

# cluster the genes so that similar rows sit together
tree = linkage(z, method="average", metric="correlation")
row_order = leaves_list(tree)
col_order = np.argsort(treated, kind="stable")   # controls first
z = z[row_order][:, col_order]

Case 3: three panels made on three different days

Before
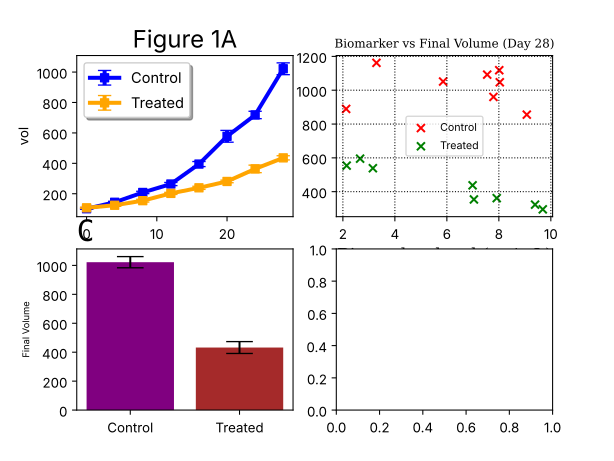
A two by two grid of plots with mismatched fonts and colours, overlapping labels, a separate legend in each panel and an empty fourth panel.
After
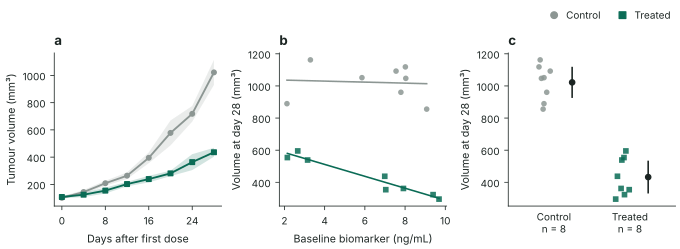
One row of three aligned panels lettered a, b and c: tumour volume over time, final volume against a baseline biomarker, and final volumes as individual points. Control is grey and treated is green throughout, with a single legend.

Diagnosis

The treated group is orange in the first panel, green in the second and brown in the third. Each panel has its own fonts and its own legend, the labels collide and the fourth slot was never filled.

Treatment

One script draws all three panels at 180 mm, a common double-column width. Control is grey and treated is green in every panel, there is one legend, and the panels are lettered and aligned. The bar chart became points, as in case 1.

From the script

style = {"Control": dict(color=GREY, marker="o"),
         "Treated": dict(color=ACCENT, marker="s")}

# one row of three panels, 180 mm wide (a typical double-column width)
fig, axes = plt.subplots(1, 3, figsize=(mm(180), mm(66)),
                         layout="constrained")

# panel letters, and one legend for the whole figure
for ax, letter in zip(axes, "abc"):
    ax.set_title(letter, loc="left", fontweight="bold", fontsize=10)

One service in three parts

Take all three together, or only the parts your paper needs.

Deep edit

I edit the whole manuscript with tracked changes, working on the language, the structure and the argument. Where a sentence is unclear or a claim isn't supported, I say so in a comment and leave the decision to you.

You receive

  • Your manuscript with tracked changes
  • Comments wherever I have a question or a larger change needs explaining

Reviewer report

A report written as a tough reviewer would write it. It covers unsupported claims, problems with the statistics, missing controls and the questions reviewers are likely to ask. This is the diagnosis, and it is easier to hear from me than from Reviewer 2.

For papers in genetics, genomics, ophthalmic genetics and vision science, and for quantitative biomedical work, I critique the science itself. In other fields I cover the statistics, the logic and the presentation.

You receive

  • A reviewer report of 2 to 3 pages

Figure rebuild

I redesign your data figures and write the code that draws them, in R or Python. You can rerun the script whenever the data change or a reviewer asks for another analysis.

You receive

  • The redesigned figures
  • The R or Python script
  • A mock dataset shaped like yours
  • A README covering the data format, how to run the script and journal export settings
  • A 30-minute screen-share handover

Your data stays with you

I don't need your real data to rebuild a figure. The script is written against a mock dataset with the same shape as yours, and you run it on the real numbers yourself.

  1. You send the figure and describe the data

    A copy of the current figure, plus the column names, data types and group sizes. No real values.

  2. I build a mock dataset

    It has the same columns and layout as yours, filled with invented numbers.

  3. I write the script on the mock data

    You receive the script, the mock dataset and a README.

  4. You run it on your real data

    On your own computer. The 30-minute screen-share means I can be there the first time you run it.

If you would rather I ran the code on your real data, I can do that under an NDA.

Packages and starting prices

The price depends on how long your manuscript is and the number of figures. Send me your abstract and I'll reply with a quote.

PackageWhat it includesPrice
Edit with reviewer report A deep edit and reviewer report for one manuscript £600 to £900 depending on length
Figure rebuild with code Redesigned figures with the script, mock dataset, README and handover £150 to £250 per figure or £600 for up to four
Full Manuscript Surgery All three parts: deep edit, reviewer report and figure rebuild £1,200 to £1,600
Grant proposal review and edit Review and edit of a grant proposal, including RGC General Research Fund and Early Career Scheme applications £500 to £800

Clients in Hong Kong are quoted in HKD.

About David Green

The part of research I've always loved most is that final stretch, when a manuscript is really coming together. I enjoy the design side, creating a set of figures to look as if they belong to the same paper and a between them tell a cohesive story. Working on the text until it reads precisely and persuasively gives me the same satisfaction.

Manuscript Surgery lets me do what I love most for your paper. I read it as an editor and as an author who has been on the receiving end of peer review, and I write every figure script myself.

By training I'm a computational geneticist. After a PhD in genetics at the University of Manchester, I stayed on as a postdoctoral researcher until 2026, working on the genetics of eye disease in UK Biobank and the Genomics England 100,000 Genomes Project. My first-author papers are numerous and have been published in Nature Communications and Investigative Ophthalmology & Visual Science, to name a few.

Alongside being an active researcher, I have edited scientific and medical manuscripts for academic editing agencies since 2013.

I also take on genetic analysis/bioinformatics projects. Get in touch if this sounds like what you need.

Papers

  • Green DJ, Julian TH, … Sergouniotis PI. Genetic insights into foveal morphology and its associations with pigmentation and age-related macular degeneration. Commun Biol. 2026. doi:10.1038/s42003-026-11248-y
  • Green DJ, Michaud V, … Sergouniotis PI. The co-occurrence of genetic variants in the TYR and OCA2 genes confers susceptibility to albinism. Nat Commun. 2024;15:8436.
  • Michaud V*, Lasseaux E*, Green DJ*, … Sergouniotis PI. The contribution of common regulatory and protein-coding TYR variants to the genetic architecture of albinism. Nat Commun. 2022;13:3939.
  • Green DJ*, Lenassi E*, … Sergouniotis PI. North Carolina macular dystrophy: phenotypic variability and computational analysis of disease-associated noncoding variants. Invest Ophthalmol Vis Sci. 2021;62:16.
  • Green DJ, Sallah SR, … Sergouniotis PI. Variability in gene expression is associated with incomplete penetrance in inherited eye disorders. Genes. 2020;11:179.

* Joint first authors

Four more papers
  • Julian TH, … Green DJ, … Sergouniotis PI. Multi-omic analysis of deep learning-derived phenotypes links ophthalmic imaging to cardiovascular and neurological traits. Nat Cardiovasc Res. 2026;5:541–554.
  • Mercier E, … Green DJ, … Javerzat S. From paleness to albinism: contribution of OCA2 exon 10 skipping to hypopigmentation. PLoS Genet. 2025;21:e1011801.
  • Andhika NS, … Green DJ, … Sergouniotis PI. Using computational approaches to enhance the interpretation of missense variants in the PAX6 gene. Eur J Hum Genet. 2024;32:1005–1013.
  • Grondin SJ, St. Pierre D, Green DJ, … Zippin JH. Targeting melanosome pH is an effective method for the treatment of oculocutaneous albinism. bioRxiv. 2026. Preprint. doi:10.64898/2026.05.27.726087

Questions

Who sees my manuscript?

Only me. I work alone and don't pass work to anyone else, and I'm happy to sign an NDA before you send anything. TO CONFIRM: how long you keep client files after a job, and how you delete them.

Do you put client documents into AI tools?

No. Your manuscript and data are never entered into AI models. The editing, the reviewer report and the figure scripts are all my own work. I use AI only for internal admin, such as automating invoices.

How long does it take?

These times run from the day I have everything I need and you have accepted the quote.

  • Edit plus reviewer report: 7 working days
  • Figure rebuild, up to four figures: 5 working days
  • Full Manuscript Surgery: 10 working days
  • Grant proposal review and edit: 7 working days

If your deadline is closer than that, tell me and I'll say whether I can meet it. For grant proposals, get in touch at least three weeks before the deadline.

Do you need my data for a figure rebuild?

No. I write the script on a mock dataset with the same shape as yours and you run it on the real data yourself. If you would rather I ran it, I can do that under an NDA.

R or Python?

Either. Tell me which one you or your lab already use and I'll write the script in that.

My paper isn't in genetics. Is this still useful?

Yes. The edit and the figure rebuild work the same way in any biomedical field. For the reviewer report, I give a full scientific critique in genetics, genomics, ophthalmic genetics and vision science, and quantitative biomedical work. In other fields the report covers the statistics, the logic and the presentation.

Can I claim the cost from research funds?

I send an invoice in GBP or HKD with the details a finance office asks for, so you can submit it for reimbursement. If your institution needs a quotation or a supplier form first, send it over. Whether the cost is eligible depends on your funder and your institution.

Do you guarantee acceptance?

No, and nobody can. What you get is a manuscript with fewer problems for a reviewer to find, and a clear list of the ones only you can fix.

Send your abstract for a quote

Paste your abstract, choose a package and give me a rough word count or number of figures. I'll reply by email with a quote within two working days.

Would you rather email? Write to david@manuscriptsurgery.co.uk.